110
THE HOMES OF MONTGOMERY COUNTY
What’s New
•
There were 325,735 housing units in Montgomery
County in 2010, an increase of 28,301 or 9.5% from
2000. While the county’s increases have been
shortening each decade, the Delaware Valley region
saw an increase in the number of units added over
the last decade, largely due to a resurgence in urban
housing in the city of Philadelphia. Housing in
central cities has been rebounding across the country
as more younger people and immigrants are drawn to
urban living choices.
•
A reversal in the trend of detached housing
dominance occurred over the last ten years. Single-
family detached homes only accounted for 37% of
all housing units added between 2000 and 2010.
Several factors accounted for the shift in residential
construction from detached to multifamily or
attached housing including an aging population, the
economic slowdown, changes in lifestyles and the
depletion of available land.
•
Countywide housing density increased from 2.6 units
per residentially developed acre in 2000 to 2.7 units
per acre in 2010. It is still well below the housing
density of 1970, which was 3.1 units per acre.
Existing Housing Totals
Housing Characteristics
Housing Costs and Affordability
Senior Housing
Group Homes and Special
Needs Housing
Jobs-Housing Balance
Future Housing Demand
Existing Housing Totals
Housing Units in Montgomery County
Over the past 60 years, Montgomery County has
consistently added a large number of homes at a wide range
of housing densities, but the total number of units added
each decade has slowly decreased. This is not surprising as
the county becomes more built out and the effects of growth
pressure are different now than they were in the post-World
War II expansion years. Infill and redevelopment in
urbanized areas are just as likely to provide new residential
units as undeveloped land in more rural parts of the county.
Most recently, housing construction in Montgomery County,
and in many areas of the United States, has been stifled by a
housing bubble that burst in the second half of the last
decade, which was followed by a national recession. During
this time, the county has experienced historically low
development activity, with residential construction dropping
to less than half of what was being built only ten years ago.
The economy and construction levels will eventually
recover to some degree as has been the nature of economic
cycles in the past. Indicators, such as housing starts and
sales data both nationally and locally, were starting to show
signs of improvement in 2012 and 2013. Shrinking
household sizes and a surplus of jobs in Montgomery
County over resident workers will continue to put pressure
on housing growth in the county.
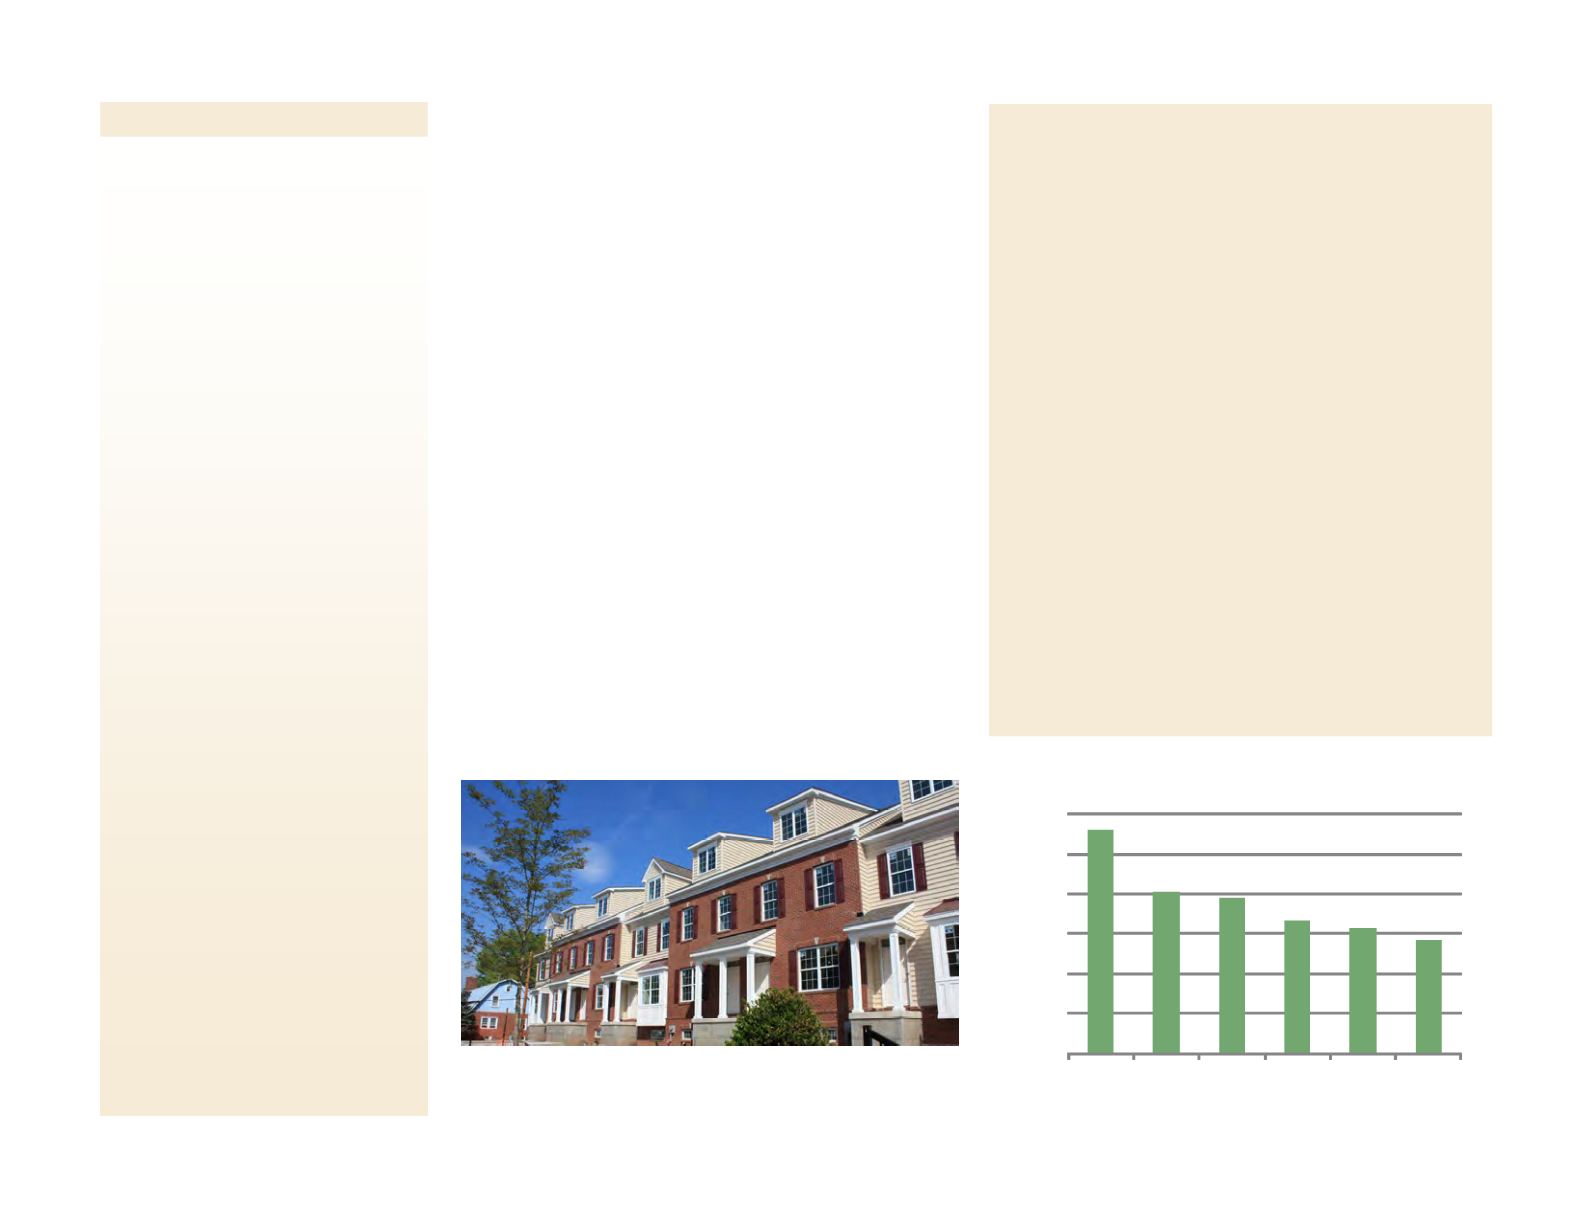
0
10,000
20,000
30,000
40,000
50,000
60,000
1950-60 1960-70 1970-80 1980-90 1990-00 2000-10
FIGURE 74:
Housing Units Added by Decade
Source: U.S. Census Bureau
Infill residential development, such as the Townhomes at Cannon Square in
Lansdale, can accommodate growth so that fewer acres of undeveloped
land are consumed.


