montgomery county today
113
Substandard Units
Substandard units are those that either lack plumbing or are
overcrowded. They are an important indicator of housing
condition, especially when concentrated at the community
or municipal level where they can potentially weaken a
neighborhood.
There are relatively few substandard units countywide,
approximately 1.2% of the total occupied units in 2010.
This was a decrease from 2000 when 1.8% of homes were
substandard. The reduction comes from a drop in
overcrowded units, which also dropped at national and
statewide levels.
Bathrooms
A home with only one bathroom can be significantly less
marketable than those with two or more. Even those who
prefer smaller homes usually want more bathrooms.
Between 2000 and 2012, the average number of
bathrooms in new single-family homes increased from 2.8
to 2.9, and from 2.4 to 2.6 in single-family attached
homes. Neighborhoods with a higher percentage of homes
with less than two bathrooms may be less marketable than
other areas.
1960s
1970s
1980s
1990s
2000s
Median Lot Size
20,000 sf
21,573 sf
21,828 sf
18,896 sf
18,377 sf
Median Home Size
2,043 sf
2,160 sf
2,328 sf
2,634 sf
3,078 sf
FIGURE 79:
Median Lot Size and House Size for Single-Family Detached Homes
Source: Montgomery County Planning Commission of Montgomery County Board of Assessment data
Home and Lot Size
It is a general trend in the United States that single-family detached homes have gotten larger over the
last century. This is especially true for suburban counties, such as Montgomery County, where the
median detached home size has increased by fifty percent since the 1960s. Interestingly, lot sizes have
actually been shrinking over the last couple of decades while home sizes continue to grow larger.
Homebuyers still seek more living area for their dollar, but they are willing to do so on a smaller area of
land. It also helps that some newer developments are designed more efficiently and provide common
open space, paths, and other amenities as a substitute for bigger private yards around each home.
0.0%
0.5%
1.0%
1.5%
2.0%
2.5%
1980
1990
2000
2010
Units Lacking Complete Plumbing Overcrowded Units
Source: U.S. Census Bureau
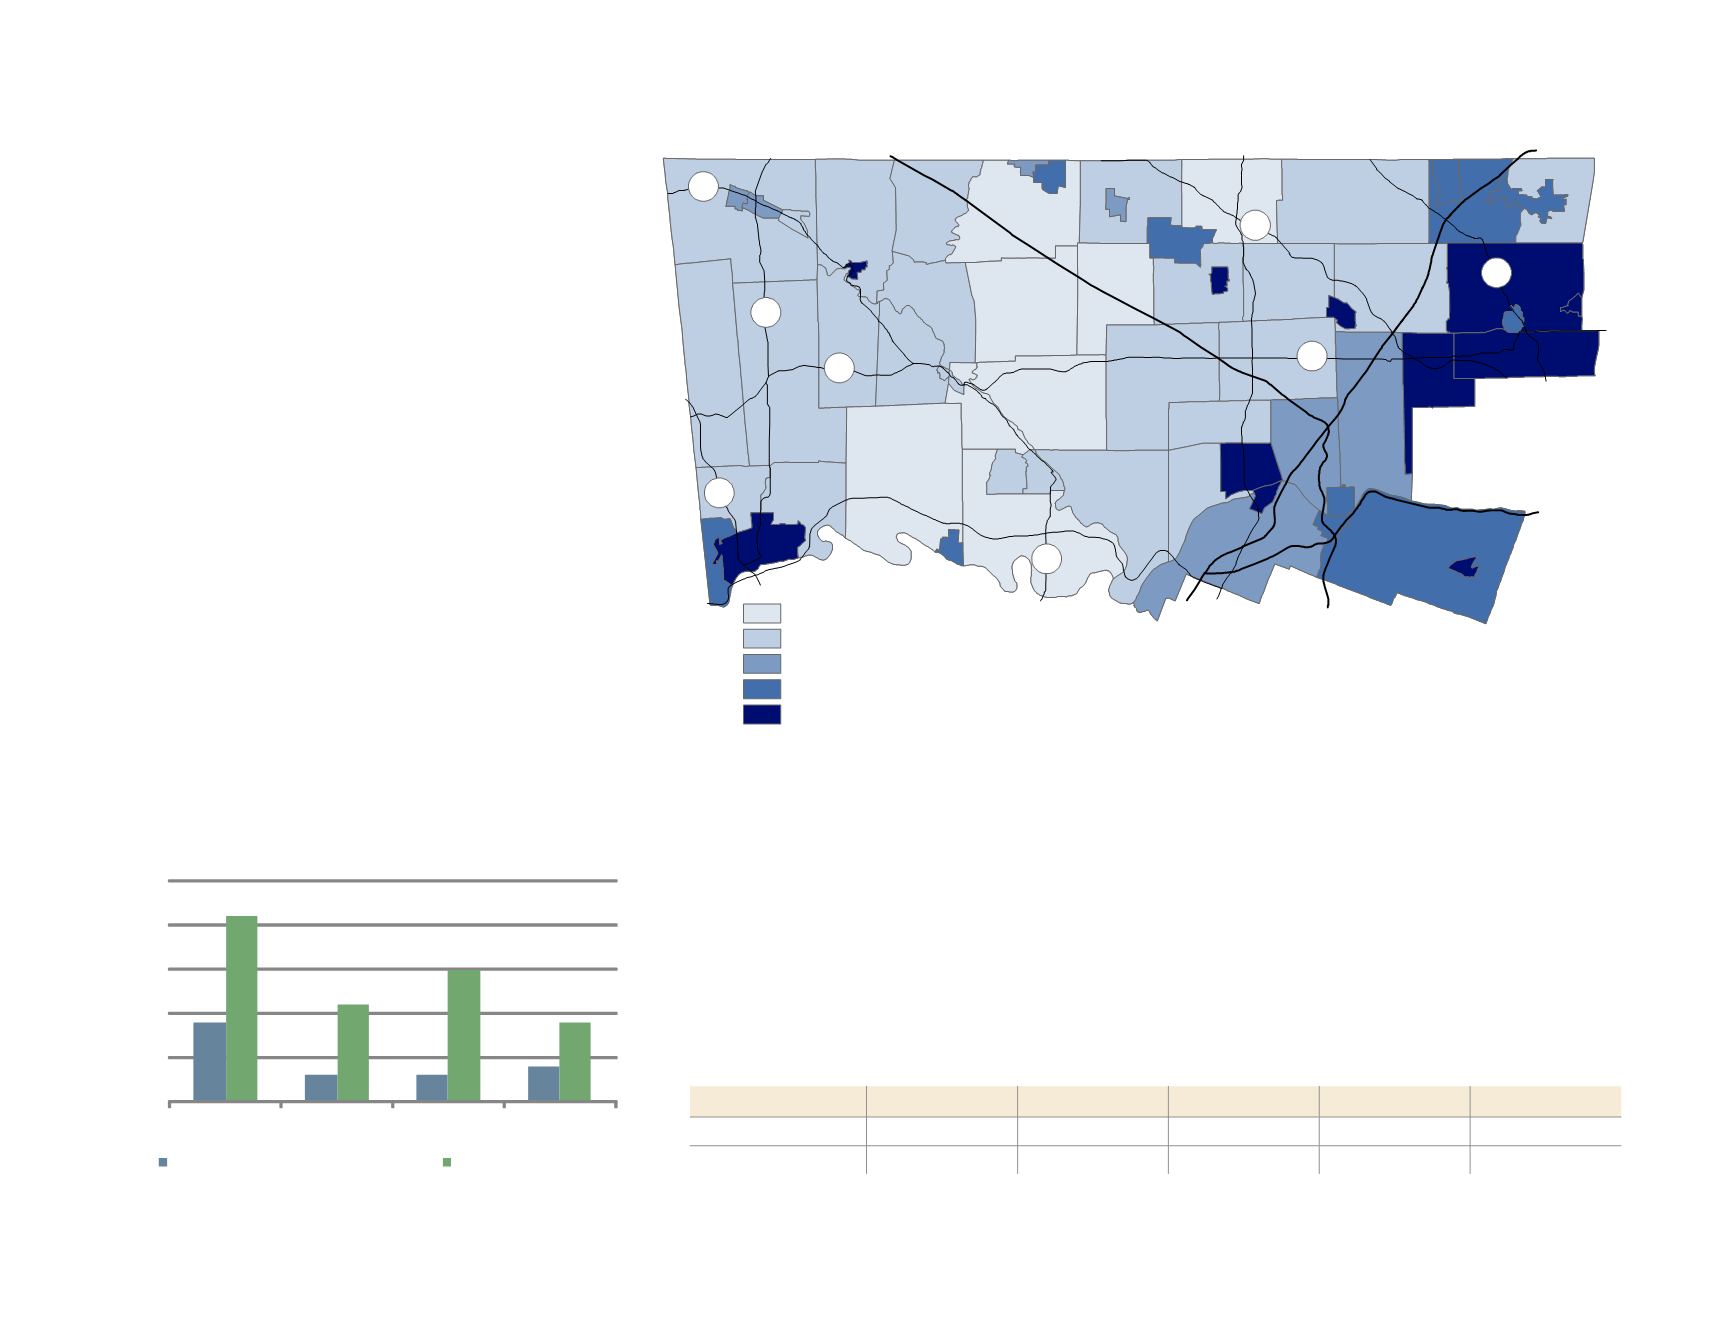
FIGURE 77:
Substandard Units as a Percent of Occupied
Units: 1980-2010
FIGURE 78:
Percent of Housing Built More Than 50 Years Ago
¯
Pottstown
Norristown
Lansdale
Collegeville
Jenkintown
Conshohocken
§¨
¦
476
§¨
¦
276
§¨
¦
76
§¨
¦
476
£
¤
422
£
¤
202
611
100
309
Hatboro
Ambler
Pennsburg
73
663
29
29
73
Under 20% of homes built before 1961
Between 20% and 40% of homes built before 1961
Between 40% and 60% of homes built before 1961
Between 60% and 80% of homes built before 1961
Over 80% of homes built before 1961
Source: U.S. Census Bureau


