montgomery county today
127
3%
4%
5%
6%
7%
8%
9%
10%
2002 2003 2004 2005 2006 2007 2008 2009 2010 2011 2012 2013
Montgomery County
Pennsylvania
United States
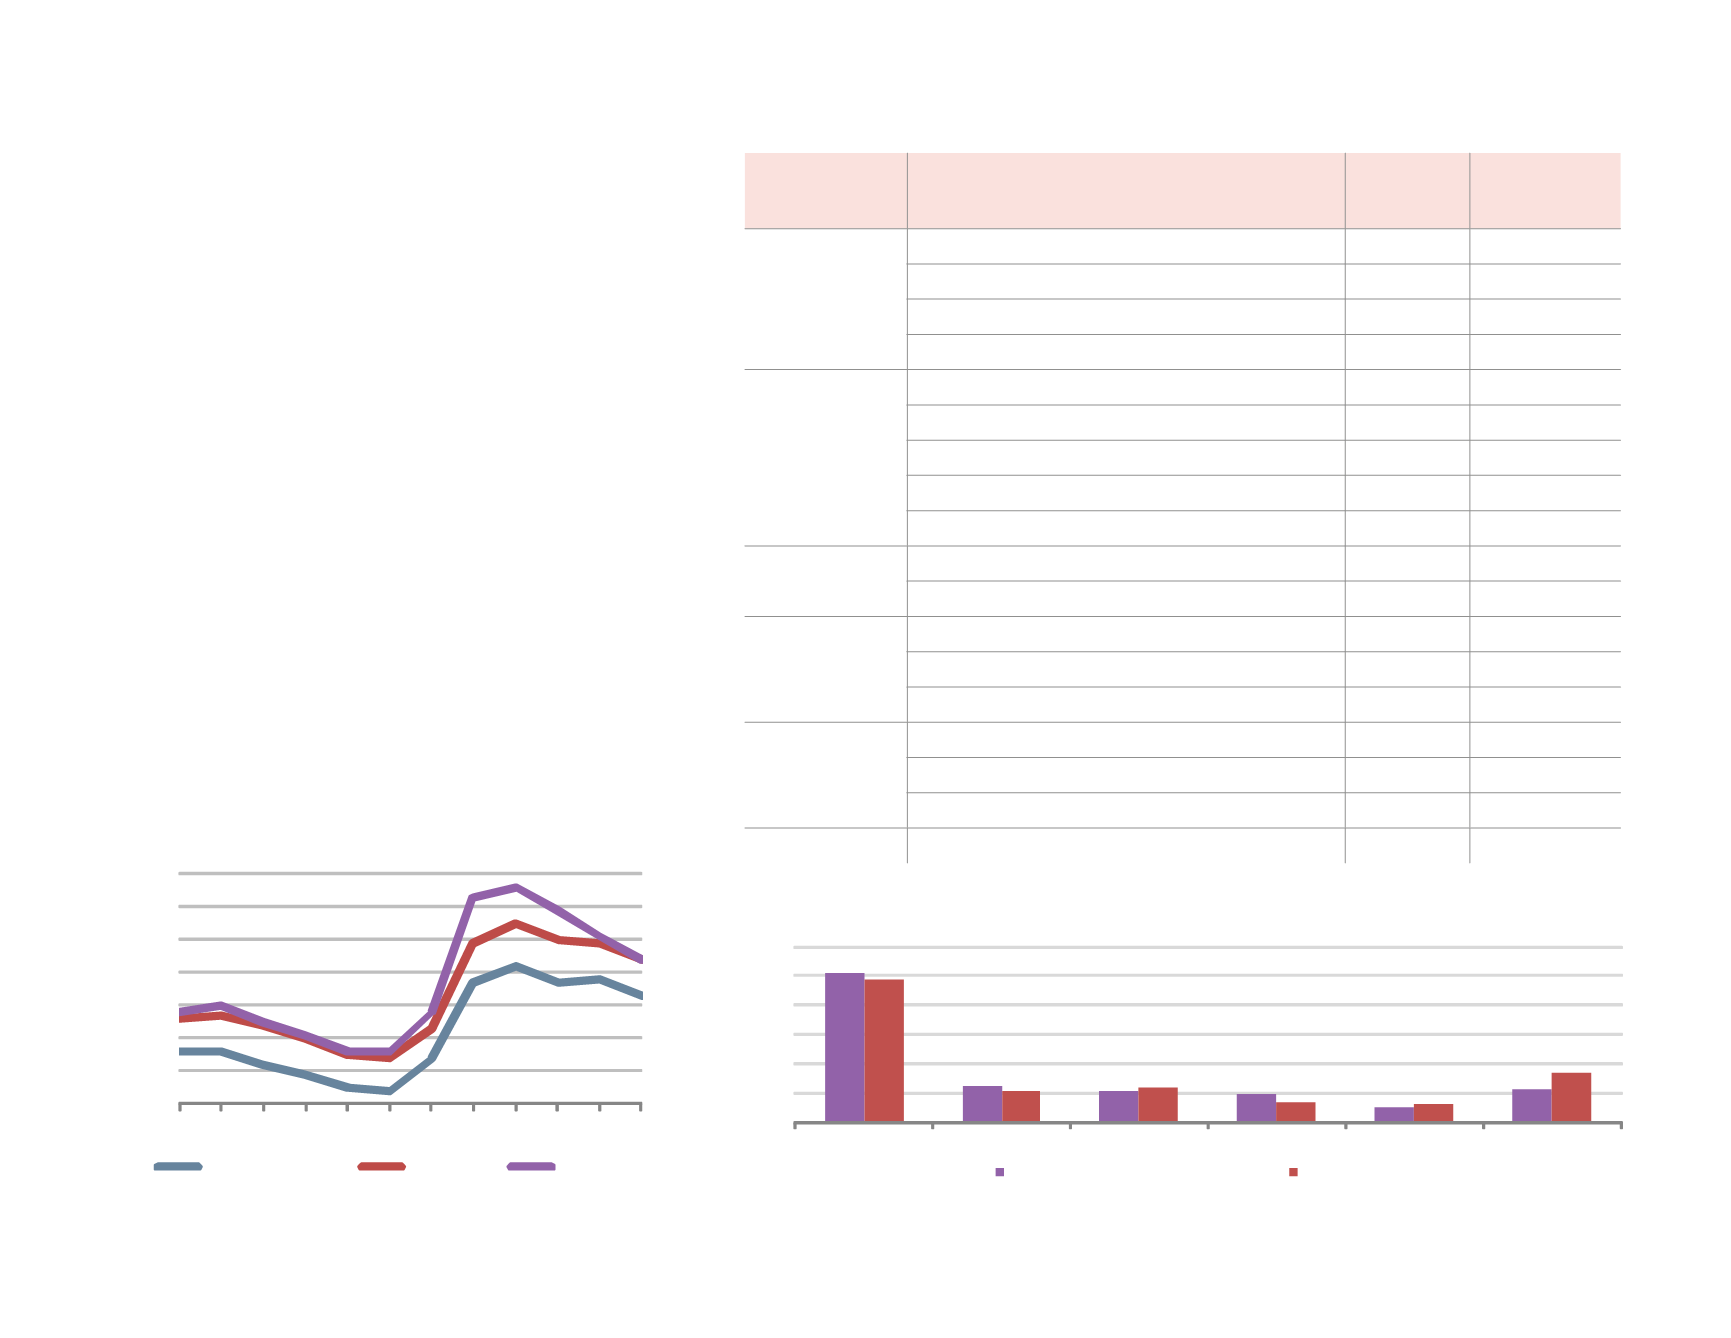
FIGURE 94:
Annual Unemployment Rate: 2002-2013
Source: Bureau of Labor Statistics
OCCUPATION
CATEGORY
OCCUPATION
SECTOR
RESIDENT
WORKERS
PERCENT OF
RESIDENT
LABOR FORCE
PROFESSIONAL /
MANAGEMENT
Management, Business, and Financial Occupations
79,043
19.2%
Computer, Engineering, and Science Occupations
35,614
8.6%
Education, Legal, Community Service, Arts, and Media Occupations
52,885
12.8%
Healthcare Practitioners and Technical Occupations
31,725
7.7%
SERVICES
Healthcare Support Occupations
6,989
1.7%
Protective Service Occupations
5,926
1.4%
Food Preparation and Serving Related Occupations
18,801
4.6%
Building and Grounds Cleaning and Maintenance Occupations
11,199
2.7%
Personal Care and Service Occupations
12,052
2.9%
SALES / OFFICE
Sales and Related Occupations
46,359
11.2%
Office and Administrative Support Occupations
53,269
12.9%
NATURAL
RESOURCES /
CONSTRUCTION
Farming, Fishing, and Forestry Occupations
368
0.1%
Construction and Extraction Occupations
15,589
3.8%
Installation, Maintenance, and Repair Occupations
10,415
2.5%
Production Occupations
16,534
4.0%
Transportation Occupations
9,745
2.4%
Material Moving Occupations
5,958
1.4%
Total
412,471
100%
PRODUCTION /
TRANSPORTATION
FIGURE 95:
Occupations of Resident Labor Force: 2013
Source: U.S. Census Bureau, American Community Survey 3-Year Estimates (average of responses between 2011-2013.
Occupations and Industries of Residents
Like the country overall, Montgomery County’s resident workers
have become more likely to work in a professional or management
occupation since 2000. These categories cover a broad spectrum
of jobs that include the fields of business, finance, computers,
science, law, education, the arts, and healthcare practice. Service
occupations have also increased as a percentage of resident
occupations. These occupations include food preparation and
serving, cleaning and maintenance, personal care, healthcare
support, and protective services.
Conversely, occupations typically associated with manual labor,
such as those found in the fields of manufacturing, construction,
transportation, material moving, and farming have declined over
the same time period. Other jobs not considered manual labor, but
often lower paying than professional or management positions,
such as sales, office, and administrative support also account for a
smaller percentage of resident occupations than they did in 2000.
Similar occupations may be related to different industries, but
approximately half of the county’s working residents were
employed in a services industry in 2011. Service industries
include professional services, scientific services, education,
healthcare, social assistance, arts/entertainment, recreation, and
food services. Outside of the service sector, the largest percentage
of county residents work in manufacturing, retail trade and
F.I.R.E. (financial, insurance, and real estate) industries.
0%
10%
20%
30%
40%
50%
60%
Services
Manufacturing
Retail Trade
F.I.R.E.
Construction
Other
Montgomery County
United States
Source: U.S. Census Bureau, American Community Survey 3-Year Estimates (average of responses between 2011-2013).
FIGURE 96:
Industries of Resident Labor Force: 2013


