montgomery county today
13
¯
Pottstown
Norristown
Lansdale
Collegeville
Jenkintown
Conshohocken
§¨
¦
476
§¨
¦
276
§¨
¦
76
§¨
¦
476
£
¤
422
£
¤
202
611
100
309
Hatboro
Ambler
Pennsburg
73
663
29
29
73
4,500 - 6,000 persons gained
3,001 - 4,500 persons gained
1,501 - 3,000 persons gained
1 - 1,500 persons gained
Loss of population
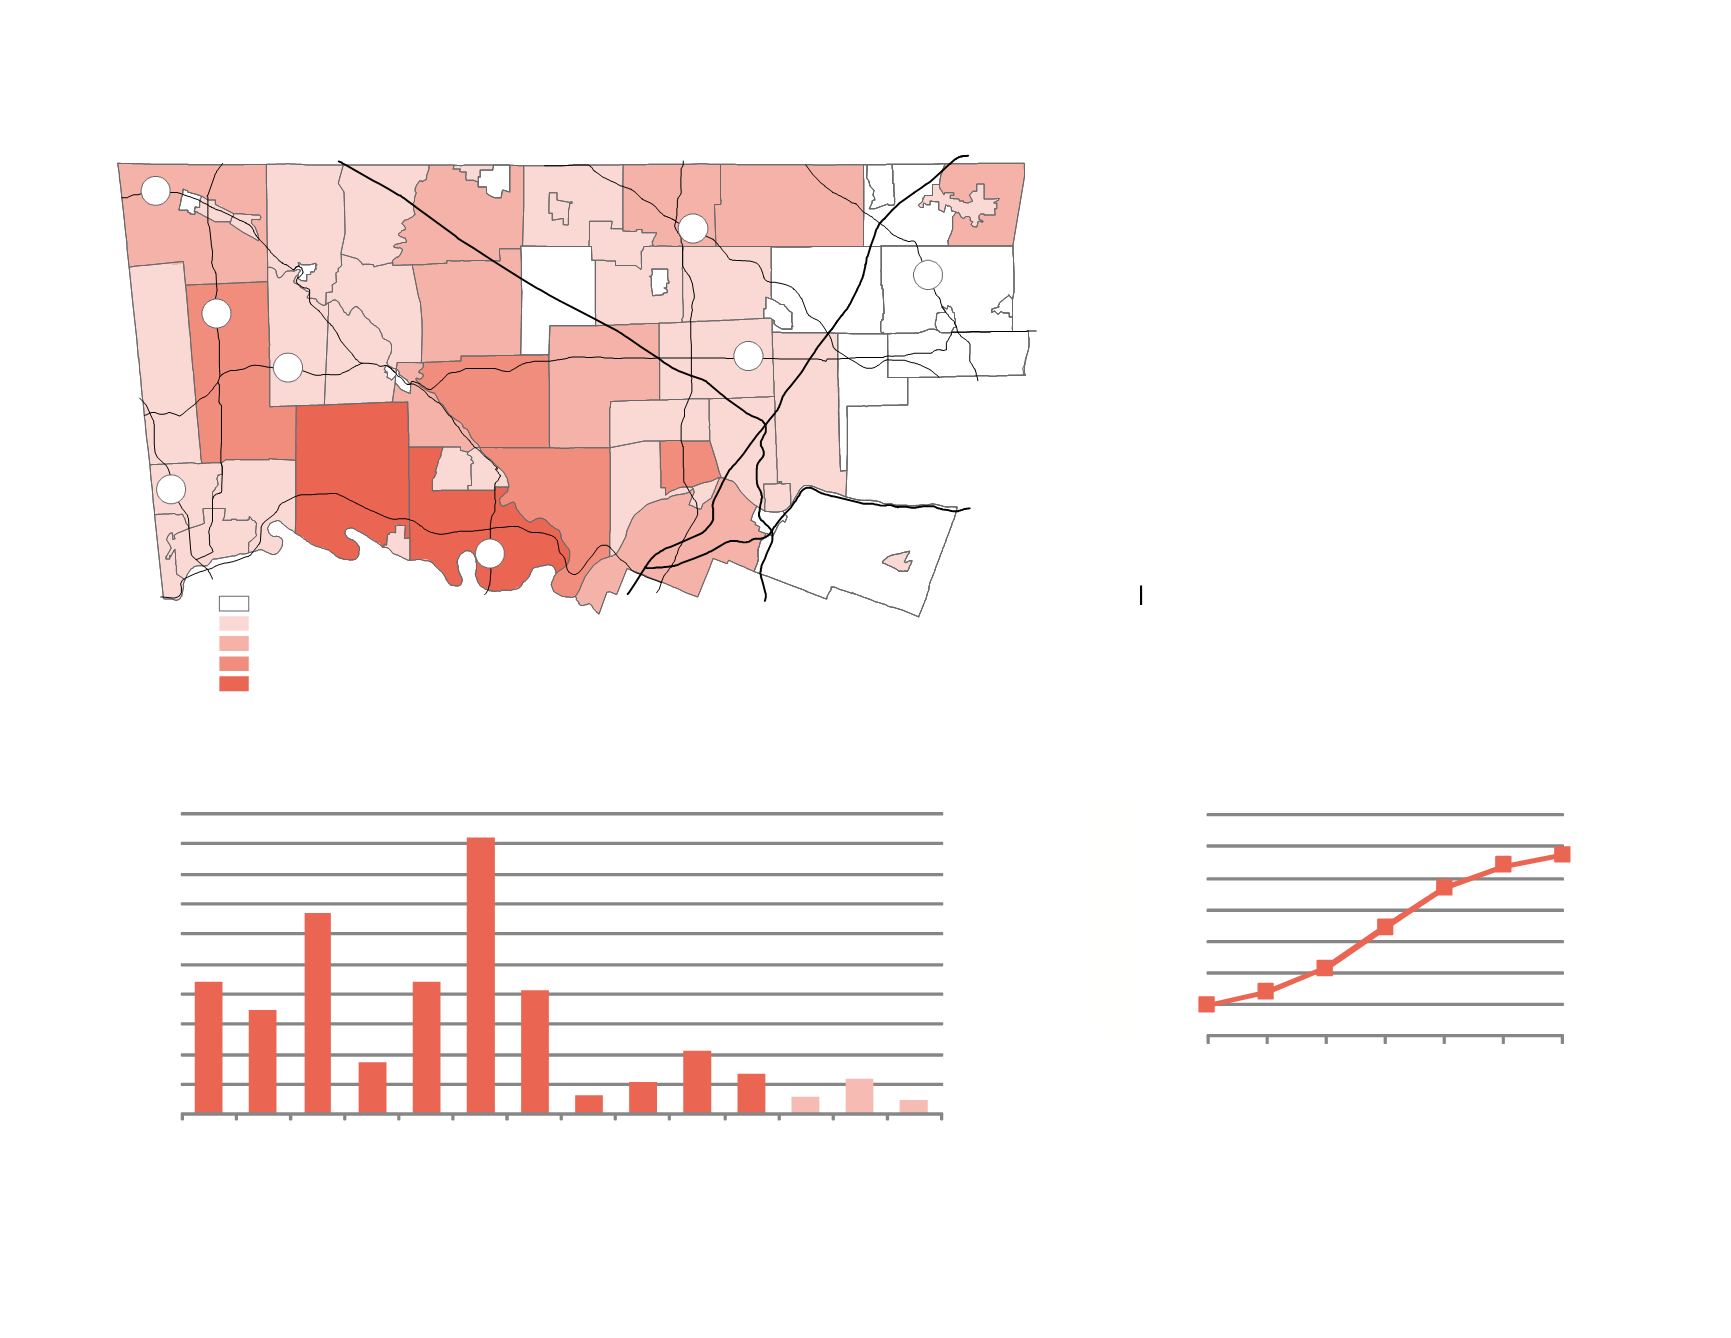
FIGURE 7:
Population Change by Municipality: 2000—2010
Population Forecast
It is unlikely that the county will be able to continue the rate
of growth in population of the last two decades—an average
of 8.6% per decade. Growth in recent years following 2010
has slowed from the Great Recession and in the current
decade, 2010-2020, the county’s population is expected to
grow by approximately 3%, or 23,690 people, which is only
half of what was gained in the previous decade.
Over the longer term, it is anticipated that the growth rate
will prove itself to be cyclic and gain at a higher rate
between 2020 and 2030. While undeveloped land will still
be limited, the redevelopment of underused sites and other
infill projects will offer growth opportunities. This trend has
already been in effect. Since 2004, over 35% of new
residential units have been built in existing developed areas
as infill or redevelopment projects.
The 2040 long range forecast for the county was formulated
by the
with
input and modifications contributed by county staff. The
forecast calls for the population of Montgomery County to
reach 894,486 by 2040, an increase of 94,612 persons or
11.8% overall.
FIGURE 9:
Forecasted Population Through 2040
780,000
800,000
820,000
840,000
860,000
880,000
900,000
920,000
2010 2015 2020 2025 2030 2035 2040
P
ers
o
n
s
894,486
799,874
Source: Delaware Valley Regional Planning Commission
Source: U.S. Census Bureau
0%
5%
10%
15%
20%
25%
30%
35%
40%
45%
50%
1900-10 1910-20 1920-30 1930-40 1940-50 1950-60 1960-70 1970-80 1980-90 1990-00 2000-10 2010-20* 2020-30* 2030-40*
* Projected Growth
Sources: U.S. Census Bureau, Delaware Valley Regional Planning Commission (projections)
FIGURE 8:
Percent Population Change by Decade, Historical and Projected
Persons


