18
THE PEOPLE OF MONTGOMERY COUNTY
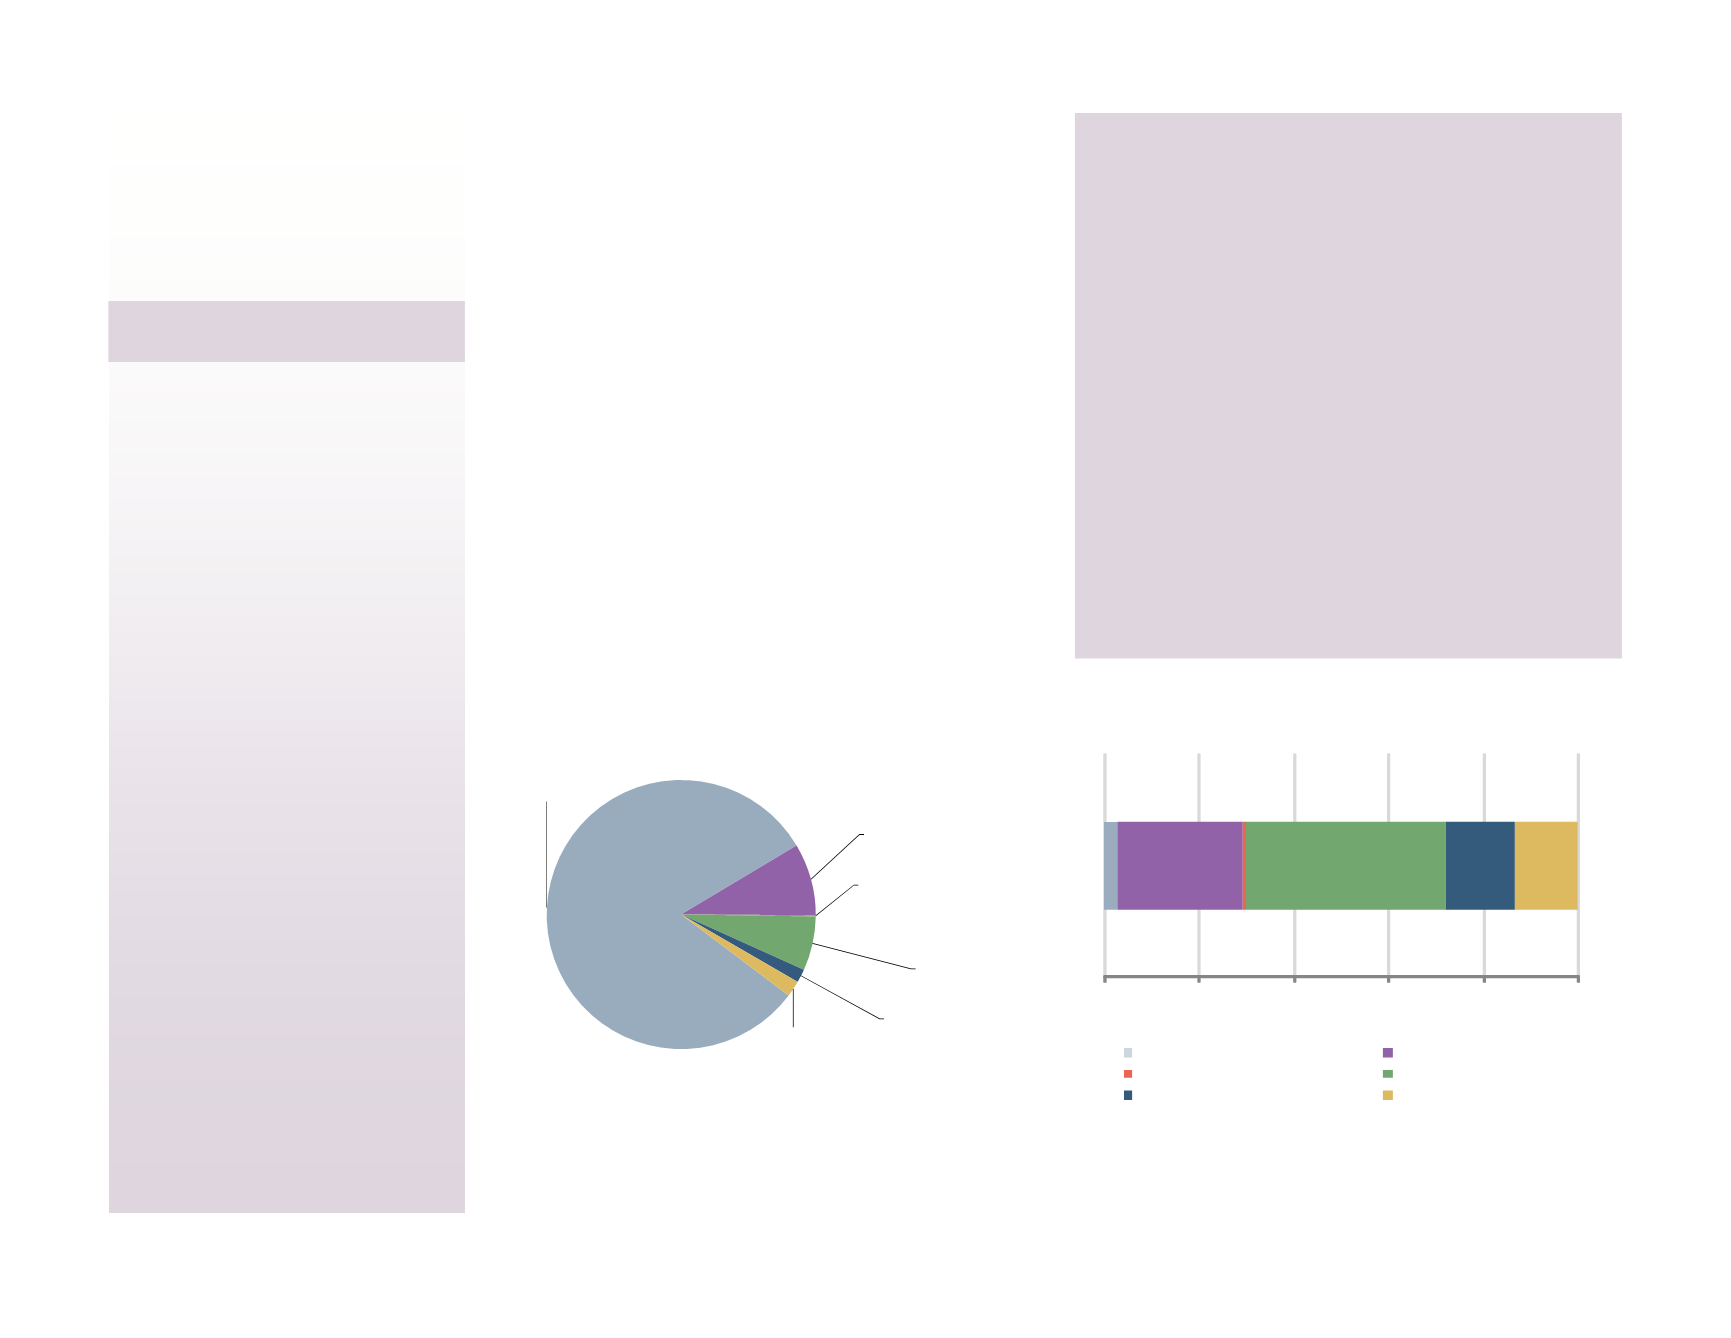
3%
26% 1% 42%
15% 13%
0% 20% 40% 60% 80% 100%
White
Black/African American
American Indian
Asian
Other
Two or More Races
Population and Projections
Household Characteristics
and Age
Income, Poverty, and Education
Race and Hispanic Origin
What’s New
•
The black population has grown since 2000 in all but
four municipalities in Montgomery County. The
largest increases were seen in inner ring suburbs near
Philadelphia as well as urban environments such as
Pottstown and Norristown.
•
Asians, which include native Hawaiians and other
Pacific Islanders, grew the most in terms of total
persons going from 30,000 in 2000 to over 50,000 in
2010. Asians with an Indian ethnicity more than
doubled in that time frame and comprise the highest
percentage of Asians (35%). Korean ethnicity is the
second largest, followed by Chinese.
•
Mexicans are the largest Hispanic ethnicity in
Montgomery County, representing 39% of all
Hispanics. They also grew the most since 2000,
adding 9,446 residents. Puerto Ricans are the second
largest Hispanic population in the county.
Race and Hispanic Origin
Racial Characteristics
Historically, Montgomery County has always been
predominately white in terms of its racial composition.
While four out of every five residents are still white, there
are some noticeable shifts occurring in the county’s racial
profile as the county’s diversity continues to grow. Almost
all of the new residents added over the last decade were of
nonwhite descent. Immigration has occurred in certain
pockets of the county, often serving as a revitalization agent
providing new blood and energy into places that had
declined or grown stagnant.
Blacks, or African Americans, remain the largest racial
group in the county behind whites, but Asians are the fastest
growing group over the last ten years. New Asian
communities have sprung up in a number of places
throughout the county, especially in the North Penn region,
around King of Prussia, and in some of the larger inner ring
suburbs bordering Philadelphia.
FIGURE 18:
Racial Composition: 2010
Source: U.S. Census Bureau
Source: U.S. Census Bureau
FIGURE 19:
Racial Composition of New Residents: 2000-
2010
White,
81.1%
Black/African
American,
8.7%
American Indian,
0.1%
Asian,
6.5%
Other,
1.6%
Two or More
Races,
1.9%


