16
THE PEOPLE OF MONTGOMERY COUNTY
Population and Projections
Household Characteristics
and Age
Income, Poverty, and
Education
Race and Hispanic Origin
What’s New
•
Montgomery County ranks 48th in median
household income out of all counties in the United
States with a population greater than 100,000. The
county also ranks second in Pennsylvania behind
Chester County.
•
Poverty is on the rise in Montgomery County. Only
2.8% of families in 1999 lived below the poverty
level, but in 2013, an estimated 4.8% of families
lived below the poverty level. However, this still
represents a relatively low percent of county
residents compared to the national rate of 11.6%.
•
Montgomery County residents are increasingly
educated. The percent of residents over the age of 25
with at least a high school diploma has risen to
93.7% in 2013, up from 88.5% in 2000.
Income, Poverty, and Education
Income
Montgomery County has a very substantial share of high
income households and a strong middle class. However, the
county was not immune to the economic struggles affecting
the United States over the last decade. Increases in
household income have failed to keep up with inflation
resulting in a “real value” loss of income since 1999.
Nationally, household incomes dropped at twice the rate as
experienced in Montgomery County. A decline in income
over ten years is not typical at county or national levels and
is indicative of the Great Recession and slow economic
growth over the last decade.
The county’s wealth is reflected in many of its communities
as all but five municipalities had median household incomes
greater than the U.S. and Pennsylvania medians. Still, over
two-thirds of municipalities in the county experienced a loss
of household income when adjusted for inflation between
1999 and 2012.
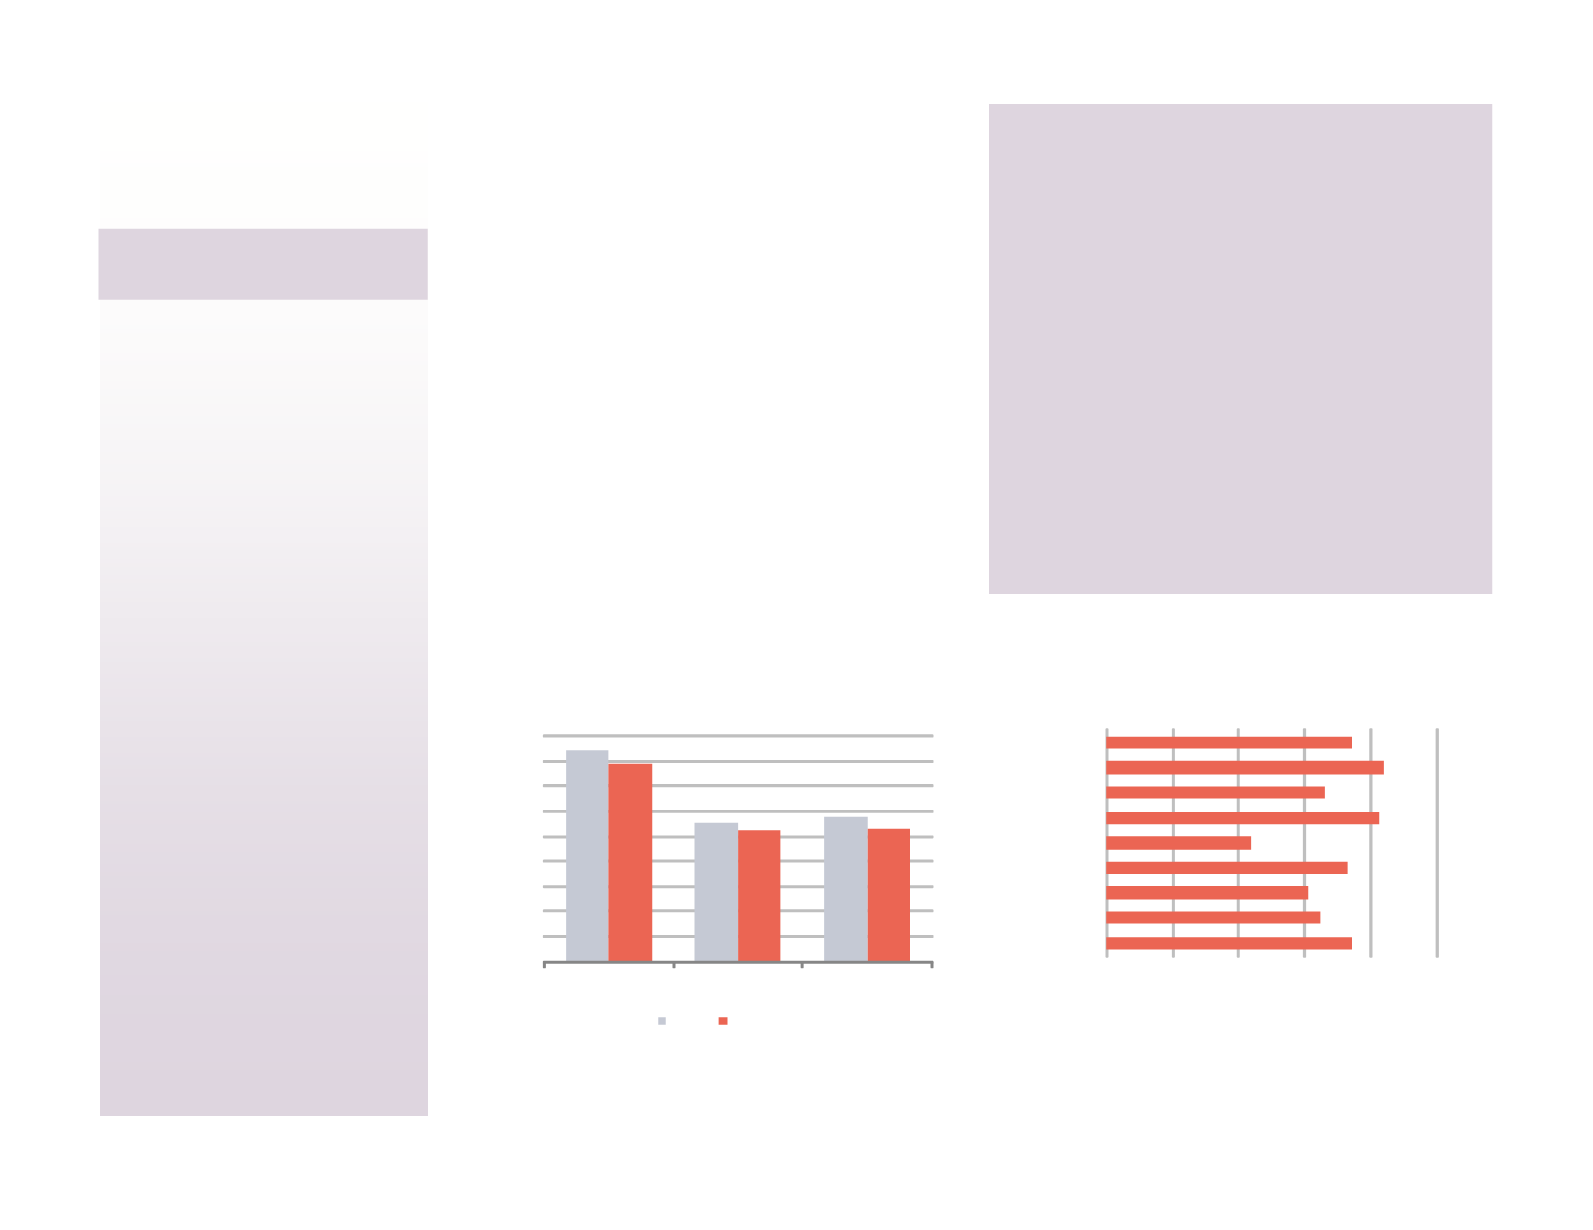
$84,254
$55,550
$58,166
$78,894
$52,267
$53 ,046
$0
$10,000
$20,000
$30,000
$40,000
$50,000
$60,000
$70,000
$80,000
$90,000
Montgomery
County
Pennsylvania
United States
1999 2012*
FIGURE 14:
Median Household Income: 1999-2012*
(Adjusted for Inflation)
* 2012 figures are actually five year estimates - an average of responses
taken between 2008 and 2012 adjusted to 2012 dollars.
Source: U.S. Census Bureau, American Community Survey
$0 $10,000 $20,000 $30,000 $40,000 $50,000
Mercer
Gloucester
Camden
Burlington
Philadelphia
Montgomery
Delaware
Chester
Bucks
FIGURE 15:
2012* Income Per Person, Counties Within
the DVRPC Region
* 2012 figures are actually five year estimates - an average of responses
taken between 2008 and 2012 adjusted to 2012 dollars.
Source: U.S. Census Bureau, American Community Survey
PLANNING ISSUE
Poverty is growing in
Montgomery County, as in
much of the country, and it
tends to be concentrated in
older developed areas.


