montgomery county today
29
!
!
!
!
!
!
!
!
!
!
!
!
!
!
!
!
!
!
!
!
!
!
!
!
!
!
!
!
!
!
!
!
!
!
!
!
!
!
!
!
!
! !
!
!
!
!
!
!
!
!
!
!
!
!
¯
Pottstown
Norristown
Lansdale
Collegeville
Jenkintown
Conshohocken
§¨
¦
476
§¨
¦
276
§¨
¦
76
§¨
¦
476
£
¤
422
£
¤
202
611
100
309
Hatboro
Ambler
Pennsburg
73
663
29
29
73
!
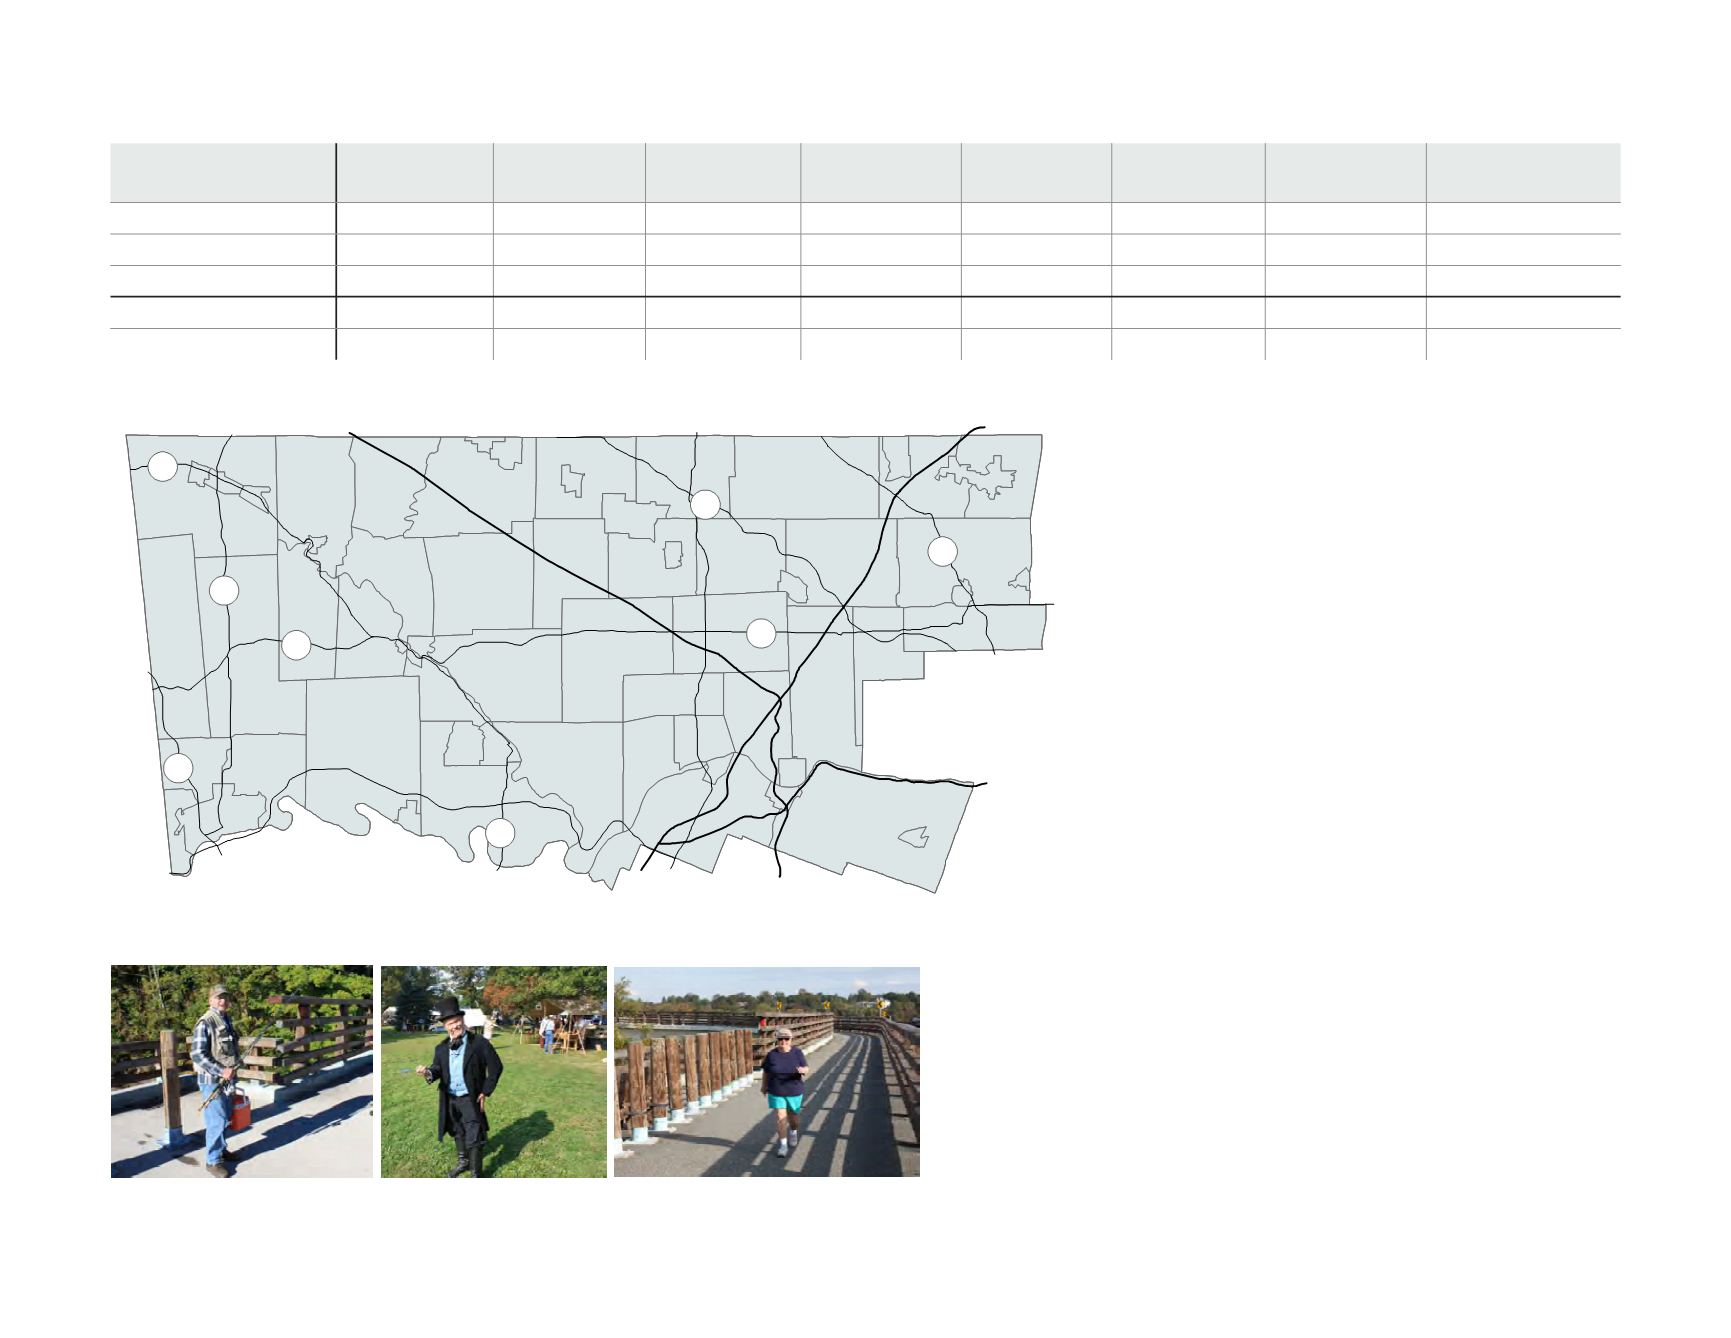
Senior Centers
!
Adult Day Care
!
Meal Delivery Provider
!
Personal Care Subcontractor
FIGURE 29:
Senior Services
AGE COHORT
PERSONS IN
2000
PERCENT OF
TOTAL
PERSONS IN
2010
PERCENT OF
TOTAL
PERSONS IN
2040
PERCENT OF
TOTAL
CHANGE
2010-2040
PERCENT CHANGE
2010-2040
55-64
68,447
9.1%
99,952
12.5%
102,366
11.4%
2,414
2.4%
65-74
55,562
7.4%
58,492
7.3%
84,588
9.5%
26,096
44.6%
75+
56,235
7.5%
62,235
7.8%
106,781
11.9%
44,546
71.6%
Total 55+
180,244
24.0%
220,679
27.6%
293,735
32.8%
73,056
33.1%
Total Population
750,097
799,874
894,486
94,612
FIGURE 28:
Over-55 Age Projections
communities among them—were designed with cars in
mind. And for those older residents who have stopped
driving, easy access to groceries, doctors, and family can
be a challenge if public transportation or shuttle services
are not readily available and sidewalk networks are
incomplete.
Educating the county’s seniors on health topics like
fitness, nutrition, and disease prevention may also become
a growing need. The county is becoming increasingly
diverse. About 10% of the county’s over-65 population is
also a racial minority. Many health concerns—such as
obesity, diabetes, and various cancers, have a
disproportionate effect on minority populations. Outreach
and educational campaigns may need to be tailored to
effectively reach these populations. The county’s growing
Hispanic and Latino population, although largely youthful
now, may require an increasingly bilingual approach to
communicate health concerns as this population grows
older.
A healthy diet and good nutrition are essentials to good
health. But low incomes or mobility problems can make
access to fresh and nutritious food a challenge for seniors.
Although the county’s farmers markets, meal delivery
services, and senior centers make access to food easier,
some seniors may skip meals if grocery shopping and
cooking are too burdensome. Turning food and eating
into a social activity with community gardens, gatherings,
and festivals may be one way of providing meals along
with a social outlet, eliminating some of the stigma of
receiving this sort of assistance.
Montgomery County’s seniors are living longer and healthier lives.
Source: Montgomery County Department of Aging and Adult Services
Sources: U.S. Census Bureau, population projections are from the Delaware Valley Regional Planning Commission


