montgomery county today
31
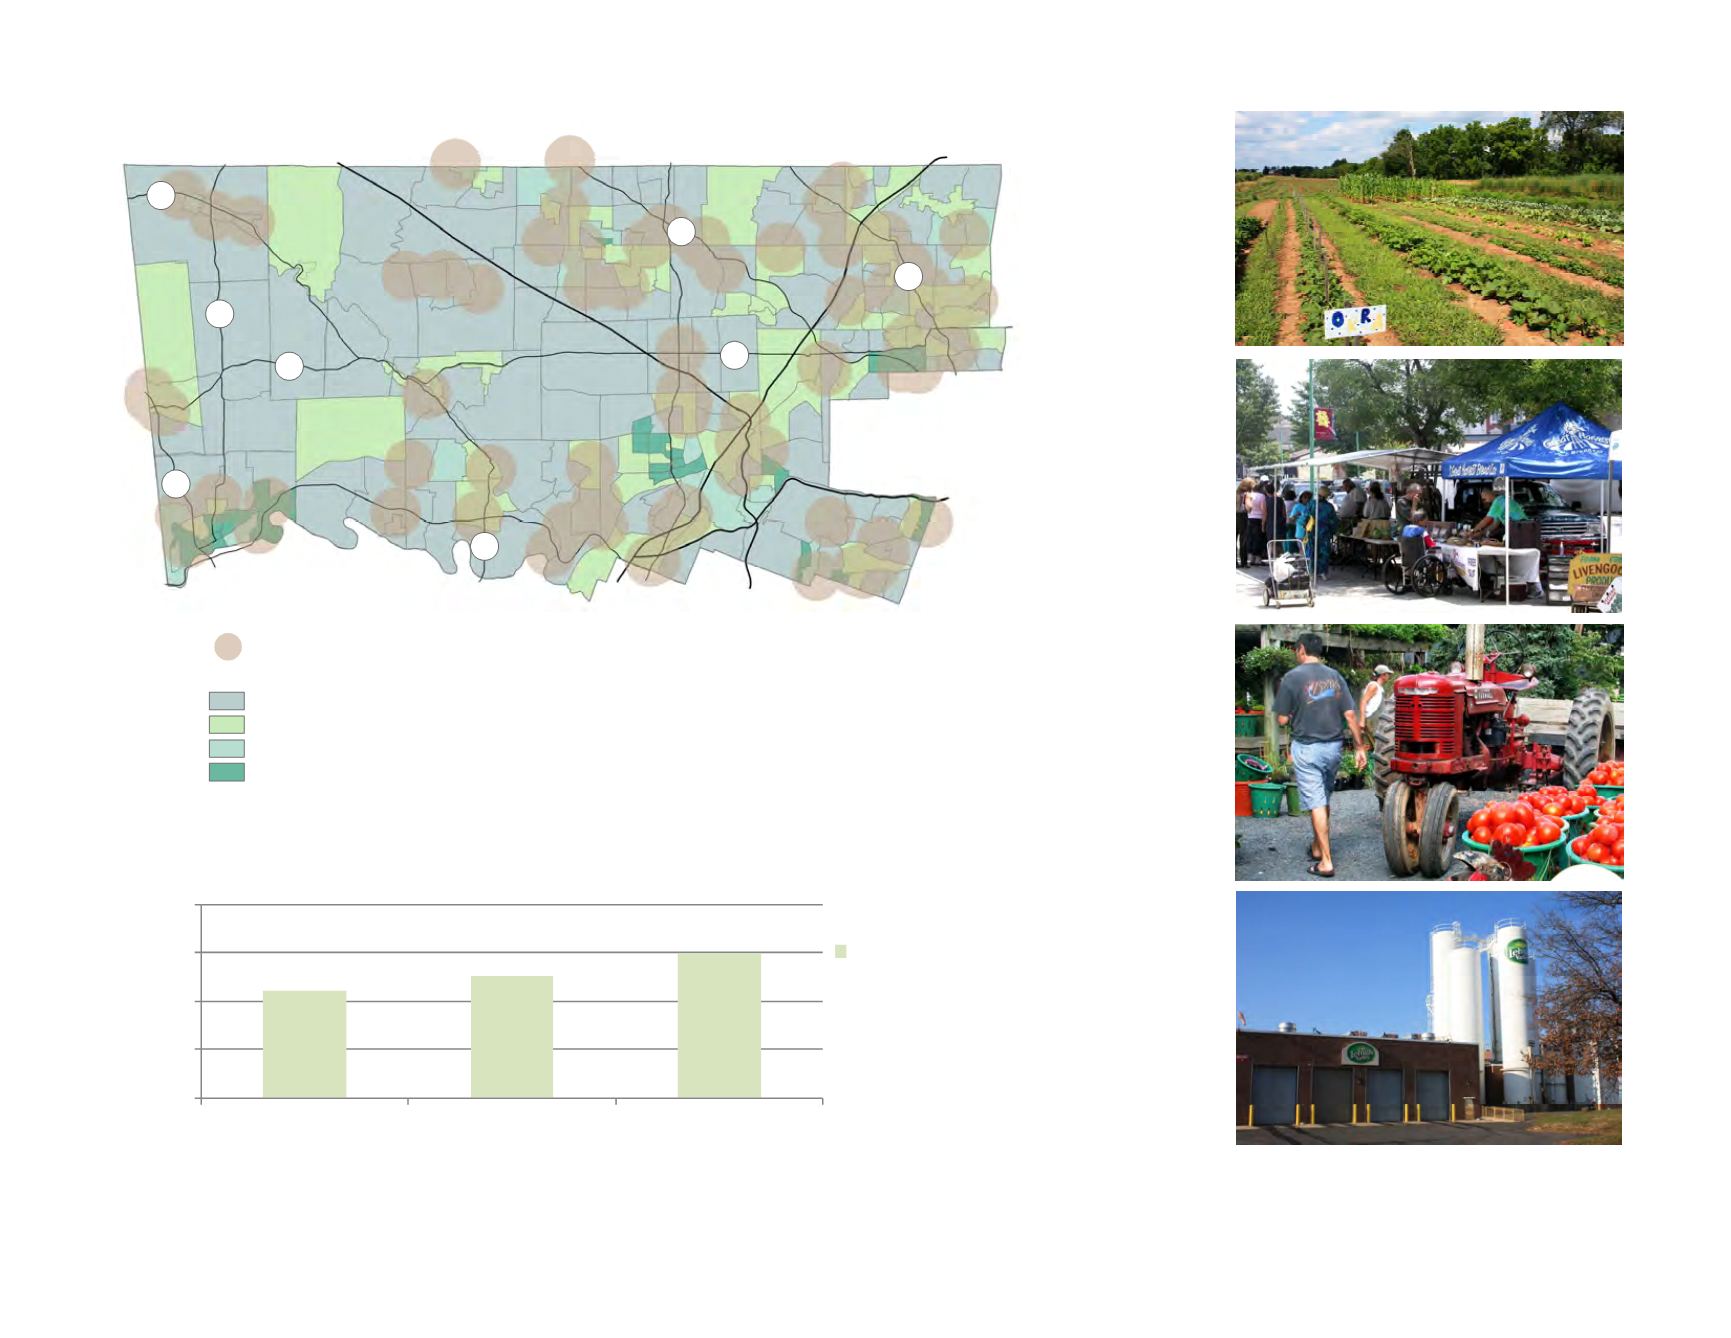
11%
12.50%
14.90%
0%
5%
10%
15%
20%
Montgomery County
Pennsylvania
United States
Percent of Residents who are Food Insecure
Percent of
Residents
who are
Food
Insecure
!
(
!
(
!
(
!
(
!
(
!
(
!
(
!
(
!
(
!
(
!
(
!
(
!
(
!
(
!
(
!
(
!
(
!
(
!
(
!
(
!
(
!
(
!
(
!
(
!
(
!
(
!
(
!
(
!
(
!
(
!
(
!
(
!
(
!
(
!
(
!
(
!
(
!
(
!
(
!
(
!
(
!
(
!
(
!
(
!
(
!
(
!
(
!
(
!
(
!
(
!
(
!
(
!
(
!
(
!
(
!
(
!
(
!
(
!
(
!
(
!
(
!
(
!
(
!
(
!
(
!
(
!
(
!
(
!
(
!
(
!
(
!
(
!
(
!
(
!
(
!
(
!
(
!
(
!
(
!
(
!
(
!
(
!
(
!
(
!!
!
!
!
!! !
!
!
!
!
!
!
!
!
!
!
!
! !!
!
!
!
!
!
!
!
!
!
!
!
!
!
!
!
!
!
!
!
!
!
!
!
! ! !
!
!
!
!
!!
!
!
!
!
!
¯
Pottstown
Norristown
Lansdale
Collegeville
Jenkintown
Conshohocken
§¨
¦
476
§¨
¦
276
§¨
¦
76
§¨
¦
476
£
¤
422
£
¤
202
611
100
309
Hatboro
Ambler
Pennsburg
73
663
29
29
73
Individuals Below Poverty Level (as of 2011)
!
(
Full Service Supermarkets
One mile radius
Less than 5 percent
5.0 - 9.9 percent
10.0 - 14.9 percent
15.0 percent and greater
!
Food Pantries and other
Emergency Food Providers
FIGURE 30:
Supermarket and Food Access
Montgomery County plays a significant role in local
food production and distribution.
FIGURE 31:
Prevalence of Household-Level Food Insecurity
Some of the county’s most densely populated areas have
some of the county’s highest poverty levels, and are not
served well by supermarkets with healthy food choices.
Sources: Montgomery County Planning Commission, U.S.
Census Bureau (poverty level data)
Source: The Coalition Against Hunger—2013 State of Hunger report


